Received: Tue 15, Jul 2025
Accepted: Wed 30, Jul 2025
Abstract
Thyroid cancer is a common head and neck malignancy, with papillary thyroid carcinoma (PTC) being the most prevalent type, accounting for 85% to 90% of cases. Currently, distant metastasis is the main cause of death in thyroid cancer. The main sites of metastasis include the lungs, bones, and brain. Among them, the overall prognosis for brain metastasis is poor, with a median survival time of about 15 months [1].
Objectives: This study aims to construct a risk prediction model for brain metastasis in thyroid cancer patients and identify core genes associated with this condition. We focused on ADRA1B and PAPSS2 genes, exploring their correlation with immune genes and cells to understand the immune mechanisms involved in brain metastasis. Additionally, we investigated small molecule compounds that can regulate these genes and studied their drug sensitivity.
Methods: We utilized bioinformatics tools and databases to collect gene expression data from GEO and TCGA databases. Differential expression analysis identified genes significantly associated with brain metastasis. Correlation analysis assessed the relationships between ADRA1B, PAPSS2, and immune cell activity. A risk prediction model was built using COX regression, and its accuracy was evaluated. Molecular docking techniques, including AutoDock Vina and CB-Dock2, simulated interactions between ADRA1B, PAPSS2, and potential therapeutic drugs like Ganetespib and BLU-667.
Results: Our study found that ADRA1B expression was significantly lower in brain metastasis samples, while PAPSS2 expression was higher. Survival analysis showed that high ADRA1B expression correlated with better survival outcomes, whereas high PAPSS2 expression correlated with poorer outcomes. We also found that ADRA1B gene expression was negatively correlated with sensitivity to multiple drugs, while PAPSS2 expression was positively correlated with sensitivity to certain drugs.
Conclusion: High ADRA1B expression is associated with better survival, while high PAPSS2 expression correlates with poorer outcomes. These genes' expression levels significantly relate to drug IC50 values, suggesting their potential as biomarkers for predicting drug response. Protein docking analysis provides insights into the interaction mechanisms between these genes and specific drugs, offering new targets and strategies for treating thyroid cancer brain metastasis.
Keywords
Thyroid cancer brain metastasis, clinical prediction model, ADRA1B, drug sensitivity
1. Introduction
Thyroid cancer is one of the most common endocrine malignancies globally, with an increasing incidence rate year by year. The Cancer Statistics Annual published by the National Cancer Center in January 2019 shows that in 2015, there were approximately 3.929 million new cases of malignant tumors diagnosed nationwide, of which thyroid malignancies accounted for 5.12%, ranking 7th. The incidence of thyroid cancer in females is significantly higher than that in males, and among female patients, the prevalence of thyroid cancer can be as high as 4th place. It can be seen that thyroid cancer has become one of the fastest-growing tumor types in terms of incidence in China. Among them, differentiated thyroid cancer rarely spreads to distant sites, and most only involve the thyroid lobe or cervical lymph nodes. According to literature reports, only 4% to 15% of patients have metastasis [2, 3], with lung metastasis being the most common, followed by bone tissue (1% to 15%). Patients with brain metastasis are rare, with statistics showing that only about 1% of differentiated thyroid cancers metastasize to the brain [4], but brain metastasis of thyroid cancer is a serious clinical consequence.
In January 2024, data released by the National Cancer Center (NCC) and the Global Cancer Observatory (GLOBOCAN) in 2022 consistently showed that in 2022, China reported 460,000 new cases of thyroid cancer (thyroid cancer, TC) and 1.63 million (5-year) prevalent cases, of which about 10,000 were deaths. Thyroid cancer accounted for 9.7% of all new diagnoses of malignant tumors, ranking 3rd, only behind lung cancer and colon cancer, and is the most common endocrine malignancy in terms of incidence. Although its overall prognosis is relatively good, it ranks 2nd in mortality among endocrine tumors, and some subtypes have a higher risk of death [5, 6]. At present, distant metastasis is the main cause of death in thyroid cancer, with the main sites of metastasis including the lungs, bones, and brain, among which the overall prognosis for brain metastasis is poor, with a median survival time of about 15 months [1]. From 2000 to 2018, the age-standardized incidence rate (ASIR) of all cancers increased by an average of about 1.4% per year. Among them, the detection rate of female thyroid cancer [average annual percentage change (AAPC) = 15.7%] and male thyroid cancer (AAPC = 16.9%) both increased significantly. Compared with the estimates of GLOBOCAN 2020, the incidence of all cancers increased by about 256,000 cases, of which thyroid cancer accounted for about 245,000 cases. In the 5-year epidemiological statistics, thyroid cancer ranked first with 1.63 million cases, indicating that thyroid cancer has become the fastest-growing tumor in terms of incidence in China [5].
Thyroid cancer brain metastasis is a severe complication in the late stage of thyroid cancer, with a very poor prognosis, the treatment method is mostly surgical [7]. Surgical treatment is becoming increasingly important in the management of brain metastases. It has the advantage of rapidly relieving intracranial pressure and clarifying pathological diagnosis [8]. However, surgical approaches for TCa vary and are closely related to pre-operative evaluations. Each clinical center determines the optimal surgical extent for PTC. Generally, lobectomy is suited for PTCs with a maximum tumor diameter of less than 1 - 1.5 cm [9]. The American Thyroid Association (ATA) guidelines suggest that for tumors of 1-4cm, risk stratification based on pathological and intra - operative features is needed to plan the surgery [10]. The ATA also expanded the criteria for lobectomy in some 1-4 cm tumors. Studies, after excluding other high - risk factors, tracked patients with tumors of ≥ 1 cm having different surgeries, finding no statistical difference in survival and recurrence rates [11, 12]. Thus, for tumors of 1-4 cm, other high-risk factors must be considered, such as multifocality, contralateral nodules, high tumor extracapsular extension, numerous lymph node metastases or maximum diameter of ≥ 3 cm, and distant metastasis. Additionally, total thyroidectomy has a higher risk of complications like hypoparathyroidism, hypocalcemia, etc., and may require readmission [13-15]. Economically, lobectomy is likely more cost-effective [16, 17]. Before treatment, it is essential to confirm the diagnosis of tumor metastasis and conduct a comprehensive and systematic assessment of the patient's condition [18]. At present, there is no standardized consensus on the efficacy and side effects of existing treatments, which is closely related to the rarity of thyroid cancer brain metastasis cases. Therefore, there is an urgent need to deeply explore the molecular mechanisms of brain metastasis and develop more effective treatment strategies [19]. This study analyzes the public gene expression data of thyroid cancer brain metastasis patients and control groups from the GEO and TCGA databases to predict the probability of thyroid cancer metastasizing to the brain in individual patients through a model. It screens for differentially expressed genes and constructs a prognostic risk model, further exploring the interaction between core genes and immune cells and their drug sensitivity, providing new targets and ideas for the diagnosis and treatment of thyroid cancer brain metastasis.
2. Materials and Methods
2.1. Data Collection
We downloaded the RNA sequencing data and corresponding clinical data of 6 normal thyroid cancer tissue samples and 2 thyroid cancer brain metastasis tissue samples from the Gene Expression Omnibus (GEO) dataset (GSE66463) at the National Center for Biotechnology Information (NCBI, (Link 1)) to analyze the gene expression differences between thyroid cancer brain metastasis and normal thyroid cancer tissues. Additionally, to further investigate the gene expression differences in thyroid cancer brain metastasis, we obtained RNA sequencing data and clinical information from the Cancer Genome Atlas (TCGA, (Link 2)).
To explore the correlation between gene expression levels and immune cell activity, we collected immune cell-related data. We intersected the differentially expressed genes identified from the GEO datasets with those from the TCGA datasets using R language. This process yielded a matrix of immune genes, which we utilized for subsequent analyses of immune cell infiltration.
2.2. Bioinformatics and Statistical Analysis
To identify significantly differentially expressed genes associated with thyroid cancer brain metastasis (Figure 1), we employed differential expression analysis methods. Using R language, we analyzed the data downloaded from the GEO and TCGA databases to obtain genes with significant differential expression related to thyroid cancer brain metastasis.
We employed a transcription-based immune infiltration analysis method to evaluate the relationship between the expression levels of the ADRA1B and PAPSS2 genes and the infiltration of different types of immune cells. First, we used R language tools to obtain the estimated values of immune cell infiltration from the TCGA database, including various immune cell types such as T cells, B cells, macrophages, and dendritic cells. Subsequently, we assessed the correlation between the expression levels of the ADRA1B and PAPSS2 genes and the degree of infiltration of various immune cells using Pearson correlation analysis. The correlation analysis was performed in R software, with the cor.test function used to calculate the correlation coefficients and p-values. The analysis results were presented in the form of heatmaps and scatter plots to demonstrate the strength and direction of the relationship between gene expression and immune cell infiltration.
To evaluate the survival risk of patients with thyroid cancer brain metastasis, we constructed a predictive model based on the expression data of the core genes ADRA1B and PAPSS2. We used the R software package survival to perform COX regression analysis, with gene expression levels as independent variables and patient survival time as the dependent variable, to identify genes significantly associated with survival prognosis. Based on the results of the COX regression analysis, we built a risk score model incorporating gene expression and clinical covariates. We calculated a risk score for each patient using a formula that integrated the effects of gene expression levels and clinical characteristics. We then assessed the model's predictive accuracy using ROC curves and the concordance index (C-index). We calculated the model's AUC value and C-index to quantify its ability to distinguish survival risk. Additionally, we employed decision curve analysis (DCA) to evaluate the model's clinical application potential at different risk thresholds, determining its value in actual clinical decision-making.
2.3. Drug Screening and Correlation Analysis
To assess the association between specific gene expression and drug sensitivity, we calculated the correlation coefficients between gene expression levels and drug IC50 values. We first collected the expression data of the core genes ADRA1B and PAPSS2 in thyroid cancer brain metastasis samples, along with the corresponding drug IC50 values, ensuring that all data were appropriately preprocessed. We then used the Pearson correlation coefficient to quantify the linear relationship between gene expression levels and drug IC50 values. The Pearson correlation coefficient (r) ranges from -1 to 1, with positive values indicating positive correlation, negative values indicating negative correlation, and values close to 0 indicating no linear correlation. We subsequently conducted significance tests for the correlation coefficients between each gene and drug IC50 values to determine whether the observed correlations were statistically significant (using the cor.test function for Pearson correlation coefficient significance testing, which actually performed a two-tailed test). A correlation coefficient of R < -0.6 or > 0.6 was considered to indicate a strong correlation (-1 < r < 1).
2.4. Molecular Docking Analysis
To simulate the interaction between the proteins encoded by ADRA1B and PAPSS2 and potential therapeutic drugs (such as Ganetespib, BLU-667, etc.), and to identify key amino acid residues and binding sites, we employed molecular docking techniques. We first prepared the receptors and ligands, obtaining the protein structures of ADRA1B and PAPSS2 from the RCSB PDB database (RCSB PDB: Homepage, (Link 3)). We then preprocessed the obtained protein structures, which included removing water molecules, adding hydrogen atoms, and calculating charges. Subsequently, we downloaded the files of small-molecule ligands from public databases such as ZINC (Welcome to ZINC Is Not Commercial, (Link 4)) and PubChem (PubChem, (Link 5)). We used the online molecular docking tool CB-Dock2 (An accurate protein-ligand blind docking tool, (Link 6)) for molecular docking. CB-Dock2 is a web-based tool that performs fully automated protein-ligand blind docking calculations by predicting protein binding sites. We created a configuration file for each protein-drug pair, specifying the receptor, ligand, search space center coordinates, and box size. After running the docking calculations, we obtained the docked conformations and extracted docking scores to evaluate the binding energy of each conformation.
3. Results and Conclusion
3.1. Gene Expression Difference Analysis Results
To elucidate the role of ADRA1B and PAPSS2 genes in thyroid cancer brain metastasis, we initially compared their expression levels between thyroid cancer brain metastasis samples and control samples. Through t-test analysis, we found that the expression level of the ADRA1B gene was significantly lower in brain metastasis samples than in control samples, while the expression level of the PAPSS2 gene was significantly higher in brain metastasis samples than in controls.
From the heatmaps of ADRA1B and PAPSS2 gene expression levels (Figures 1A & 1B), the gradient of colors from blue (indicating low expression) to red (indicating high expression) visually illustrates the differences in gene expression levels. These results indicate that, compared to control samples, ADRA1B expression is downregulated in thyroid cancer brain metastasis samples, whereas PAPSS2 expression is upregulated.
3.2. Risk Model Assessment Results
In this study, we constructed a risk prediction model for thyroid cancer brain metastasis based on the expression data of the ADRA1B and PAPSS2 genes. The model was derived through COX regression analysis, with the risk score formula as follows: Risk score = -1.2537043002605*Exp(ADRA1B)+0.129184146518898*Exp(PAPSS2)
The construction and assessment results of the model are as follows:
The docking analysis of the ADRA1B gene with drugs such as Ganetespib and BLU-667 revealed that the ADRA1B gene is significantly negatively correlated with the sensitivity to these drugs. The regression coefficient (coef) was calculated to be (-1.2537043002605), and the hazard ratio (HR) is Exp (-1.2537043002605), indicating that high expression of the ADRA1B gene is associated with lower drug sensitivity (Figure 2).
The docking analysis of the PAPSS2 gene with drugs such as BLU-667 and XAV-939 showed that the PAPSS2 gene is significantly positively correlated with the sensitivity to these drugs. The regression coefficient (coef) was calculated as 0.129184146518898, and the hazard ratio (HR) is Exp (0.129184146518898), indicating that high expression of the PAPSS2 gene is associated with higher drug sensitivity.
We plotted the ROC curve and calculated the AUC value to evaluate the model's ability to distinguish between high-risk and low-risk patients. The closer the AUC value is to 1, the higher the model's predictive accuracy. The AUC value of the model was 0.731, indicating good predictive accuracy.
Decision curve analysis (DCA) demonstrated that the model has good clinical application potential at multiple risk thresholds (Figure 2).
3.3. Immune Cell Correlation Analysis Results
In this study, we assessed the relationship between the core genes ADRA1B and PAPSS2 of thyroid cancer brain metastasis and the activity of different types of immune cells through correlation analysis. The key findings are as follows (Figure 3).
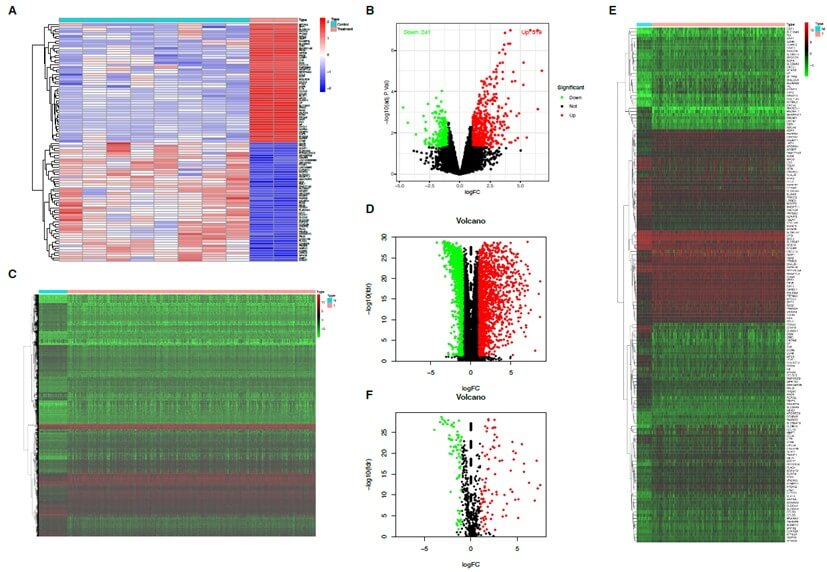
A) Heatmap of gene expression in the experimental and control groups from the GEO dataset (GSE66463). The heatmap illustrates the overall differences in gene expression between the experimental and control groups. The x-axis represents samples, while the y-axis represents genes. Red indicates high expression, and blue indicates low expression, clearly highlighting the significant differences between the two groups. B) Volcano plot of gene expression in the experimental and control groups from the GEO dataset (GSE66463): The volcano plot uses log2 fold change (log2FC) on the x-axis and -log10 adjusted p-value on the y-axis. Red dots represent significantly upregulated genes, green dots represent significantly downregulated genes, and black dots represent genes with no significant difference. C) Heatmap of differential gene expression between tumor and normal tissues in thyroid cancer brain metastasis genes extracted from TCGA clinical data: The heatmap compares gene expression between tumor and normal tissues. Red indicates high expression, and green indicates low expression. Clustering analysis of samples and genes highlights the differences in expression patterns between tumor and normal tissues. D) Volcano plot of differential gene expression between tumor and normal tissues in thyroid cancer brain metastasis genes extracted from TCGA clinical data: The volcano plot intuitively displays the distribution of differentially expressed genes between tumor and normal tissues in thyroid cancer brain metastasis genes. Red dots represent significantly upregulated genes, and green dots represent significantly downregulated genes, revealing significant changes in tumor-related genes. E) Heatmap of differential expression comparison between tumor and normal tissues in the thyroid cancer brain metastasis gene set derived from the intersection of GEO and TCGA: This heatmap focuses on the expression differences in the thyroid cancer brain metastasis gene set derived from the intersection of GEO and TCGA between tumor and normal tissues. Red and green correspond to high and low expression areas, respectively, illustrating the potential role of the gene set in tumor development. F) Volcano plot of differential expression comparison between tumor and normal tissues in the thyroid cancer brain metastasis gene set derived from the intersection of GEO and TCGA. The volcano plot intuitively presents the significantly upregulated and downregulated genes (red and green dots, respectively) in the thyroid cancer brain metastasis gene set, further emphasizing the key expression differences between tumor and normal tissues.

A) The forest plot of key prognostic genes in thyroid cancer brain metastasis (TCBM) displays the hazard ratios (HR) and 95% confidence intervals (CI) of the key prognostic genes associated with TCBM, with significant p-values annotated. Genes with HR > 1 (e.g., PAPSS2, GPR132, RGS16) are considered high-risk genes, while those with HR < 1 (e.g., ADRA1B, LRG1) are considered low-risk genes and may have protective or tumor-suppressive functions. B) The multivariate Cox regression analysis of TCBM genes demonstrates the risk contributions of ADRA1B (HR = 0.29, p = 0.004) and PAPSS2 (HR = 1.14, p < 0.001) in TCBM. The results indicate that ADRA1B is a protective factor, while PAPSS2 is a risk factor. C) The DCA curve of the single-gene prediction model based on ADRA1B (Model 1) analyzes the mortality chances of the ADRA1B gene at high-risk thresholds for TCBM, showing good predictive performance. D) The DCA curve of the single-gene prediction model based on PAPSS2 (Model 2) analyzes the mortality chances of the PAPSS2 gene at high-risk thresholds for TCBM, indicating good predictive performance. E) The combined DCA of Model 1 and Model 2 highlights the comparison of mortality chances for the ADRA1B and PAPSS2 genes at high-risk thresholds for TCBM, demonstrating good predictive performance for both genes. F) The ROC curve of the multivariate risk model based on the ADRA1B and PAPSS2 genes. The AUC value of 0.731 indicates good discriminatory performance, suggesting potential clinical diagnostic value. G) The survival analysis curve shows that patients with high expression of the ADRA1B gene have significantly better survival rates than those with low expression (p = 0.01), suggesting its potential tumor-suppressive role. H) The survival analysis curve shows a significant decrease in survival rates for patients with high expression of PAPSS2 (p = 0.022), suggesting its potential oncogenic role.
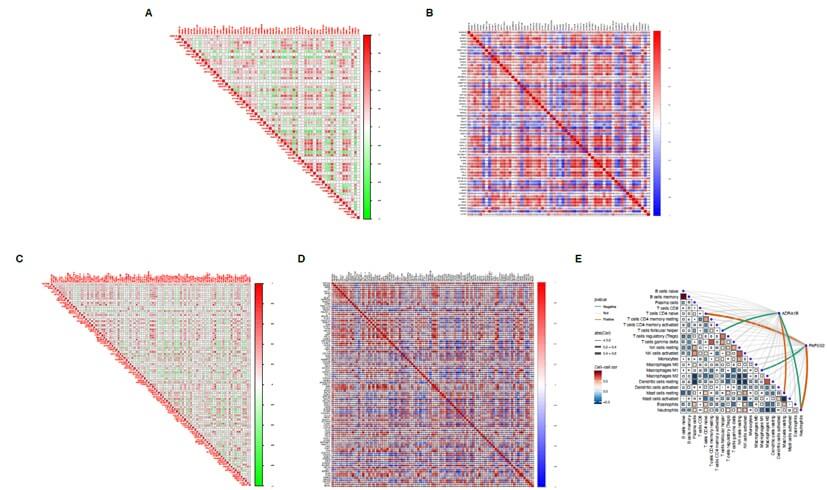
A) Heatmap of the correlation matrix between the core gene ADRA1B of thyroid cancer brain metastasis and immune genes (green-red gradient). This matrix displays the correlation between the core gene ADRA1B of thyroid cancer brain metastasis and immune genes, with green indicating negative correlation and red indicating positive correlation. The intensity of the colors reflects the magnitude of the correlation coefficients. B) Heatmap of the correlation between the core gene ADRA1B of thyroid cancer brain metastasis and immune genes (blue-red gradient). This matrix represents the direction and strength of the correlation between the core gene ADRA1B of thyroid cancer brain metastasis and immune genes using a blue-to-red gradient. Blue indicates negative correlation, red indicates positive correlation, and the darker the color, the stronger the correlation. C) Heatmap of the correlation matrix between the core gene PAPSS2 of thyroid cancer brain metastasis and immune genes (green-red gradient). This matrix displays the correlation between the core gene PAPSS2 of thyroid cancer brain metastasis and immune genes. Green indicates negative correlation, red indicates positive correlation, and the intensity of the colors represents the strength of the correlation coefficients. D) Heatmap of the correlation between the core gene PAPSS2 of thyroid cancer brain metastasis and immune genes (blue-red gradient). This matrix shows the correlation between the core gene PAPSS2 of thyroid cancer brain metastasis and immune genes using a blue-to-red color gradient. Blue represents negative correlation, red represents positive correlation, and the deeper the color, the more significant the correlation. E) Immune cell infiltration map of the core genes (ADRA1B and PAPSS2) in thyroid cancer brain metastasis. This map displays the significant correlation between key genes (such as ADRA1B and PAPSS2) and different immune cell types. The color of the lines indicates the direction of the correlation (orange for positive correlation and green for negative correlation), and the thickness of the lines reflects the strength of the correlation. Significance is annotated based on p-values, showing the potential interaction between the core genes (ADRA1B and PAPSS2) and immune cells in the tumor microenvironment.
From the correlation analysis results of the ADRA1B gene, the expression of the ADRA1B gene was significantly negatively correlated with T cell follicular helper activity (Tfh) (Pearson correlation coefficient = -0.41, adjusted p-value = 0.015) (Table 1). This indicates that an increase in the expression level of the ADRA1B gene is associated with a decrease in Tfh cell activity. The expression of the ADRA1B gene was significantly positively correlated with mast cell resting activity (Pearson correlation coefficient = 0.38 (Figure 4), adjusted p-value = 0.025). This shows that high expression of the ADRA1B gene is associated with enhanced activity of mast cells in the resting state. The expression of the ADRA1B gene was negatively correlated with neutrophil activity (Pearson correlation coefficient = -0.40, adjusted p-value = 0.018).
Table. 1. Cellular immune correlation of the ADRA1B
gene.
|
Gene |
Cell |
Correlation |
P value |
|
ADRA1B |
B cells naive |
0.00262154628549252 |
0.98826007605973 |
|
ADRA1B |
B cells memory |
0.0647284613993619 |
0.716087360493229 |
|
ADRA1B |
Plasma cells |
0.132467532467532 |
0.453641926974449 |
|
ADRA1B |
T cells CD8 |
-0.123241626 |
0.487437088211275 |
|
ADRA1B |
T cells CD4 naive |
0.302694357875705 |
0.0818482572535571 |
|
ADRA1B |
T cells CD4 memory resting |
-0.028279471 |
0.873857997083049 |
|
ADRA1B |
T cells CD4 memory activated |
-0.225290001 |
0.200171606905809 |
|
ADRA1B |
T cells follicular helper |
-0.414966696 |
0.014674587418065 |
|
ADRA1B |
T cells regulatory (Tregs) |
-0.149523179 |
0.398663430407546 |
|
ADRA1B |
T cells gamma delta |
-0.240187944 |
0.17122885676024 |
|
ADRA1B |
NK cells resting |
-0.07776929 |
0.660925014562264 |
|
ADRA1B |
NK cells activated |
0.0472116119174943 |
0.790426007619168 |
|
ADRA1B |
Monocytes |
-0.088725526 |
0.617787112447157 |
|
ADRA1B |
Macrophages M0 |
-0.115333645 |
0.5160001516541 |
|
ADRA1B |
Macrophages M1 |
0.247656694615277 |
0.157900069189431 |
|
ADRA1B |
Macrophages M2 |
0.053938421732787 |
0.761913616483703 |
|
ADRA1B |
Dendritic cells resting |
-0.087924703 |
0.620975995016021 |
|
ADRA1B |
Dendritic cells activated |
0.042449218481483 |
0.81159539969348 |
|
ADRA1B |
Mast cells resting |
0.383331739837575 |
0.0252311584690628 |
|
ADRA1B |
Mast cells activated |
-0.19268006 |
0.274941137086488 |
|
ADRA1B |
Eosinophils |
0.162828207853569 |
0.357525074805436 |
|
ADRA1B |
Neutrophils |
-0.403011488 |
0.018115371097065 |
From the correlation analysis results of the PAPSS2 gene (Table 2), the expression of the PAPSS2 gene was significantly positively correlated with eosinophil activity (Pearson correlation coefficient = 0.39, adjusted p-value = 0.022), indicating that an increase in the expression of the PAPSS2 gene is associated with enhanced eosinophil activity. The expression of the PAPSS2 gene was also significantly negatively correlated with macrophage M1 activity (Pearson correlation coefficient = -0.37, adjusted p-value = 0.031). These correlation analysis results reveal significant associations between the expression of the ADRA1B and PAPSS2 genes and the activity of specific immune cells (Figure 4), suggesting that these genes play a role in regulating immune responses and influencing the progression of thyroid cancer brain metastasis.
Table. 2. Cellular immune correlation of the PAPSS2
gene.
|
Gene |
Cell |
Correlation |
P value |
|
PAPSS2 |
B cells naive |
0.103165557 |
0.56150638 |
|
PAPSS2 |
B cells memory |
0.047589956 |
0.78926389 |
|
PAPSS2 |
Plasma cells |
0.055156608 |
0.75604987 |
|
PAPSS2 |
T cells CD8 |
0.202293637 |
0.25123513 |
|
PAPSS2 |
T cells CD4 naive |
0.421840009 |
0.0129576 |
|
PAPSS2 |
T cells CD4 memory resting |
0.330604197 |
0.05616909 |
|
PAPSS2 |
T cells CD4 memory activated |
-0.12795678 |
0.47080196 |
|
PAPSS2 |
T cells follicular helper |
0.081185627 |
0.64807545 |
|
PAPSS2 |
T cells regulatory (Tregs) |
-0.018532 |
0.91714862 |
|
PAPSS2 |
T cells gamma delta |
0.094188105 |
0.5962201 |
|
PAPSS2 |
NK cells resting |
0.0710466 |
0.68873663 |
|
PAPSS2 |
NK cells activated |
0.203666921 |
0.24693119 |
|
PAPSS2 |
Monocytes |
-0.20608821 |
0.24226392 |
|
PAPSS2 |
Macrophages MO |
-0.20405183 |
0.24705131 |
|
PAPSS2 |
Macrophages M1 |
-0.37005593 |
0.03122451 |
|
PAPSS2 |
Macrophages M2 |
-0.2539537 |
0.14725757 |
|
PAPSS2 |
Dendritic cells resting |
0.002608586 |
0.98831811 |
|
PAPSS2 |
Dendritic cells activated |
-0.00462149 |
0.97930535 |
|
PAPSS2 |
Mast cells resting |
-0.02663147 |
0.88115537 |
|
PAPSS2 |
Mast cells activated |
-0.29249628 |
0.09321531 |
|
PAPSS2 |
Eosinophils |
-0.10897452 |
0.53955304 |
|
PAPSS2 |
Neutrophils |
0.391510196 |
0.02203581 |
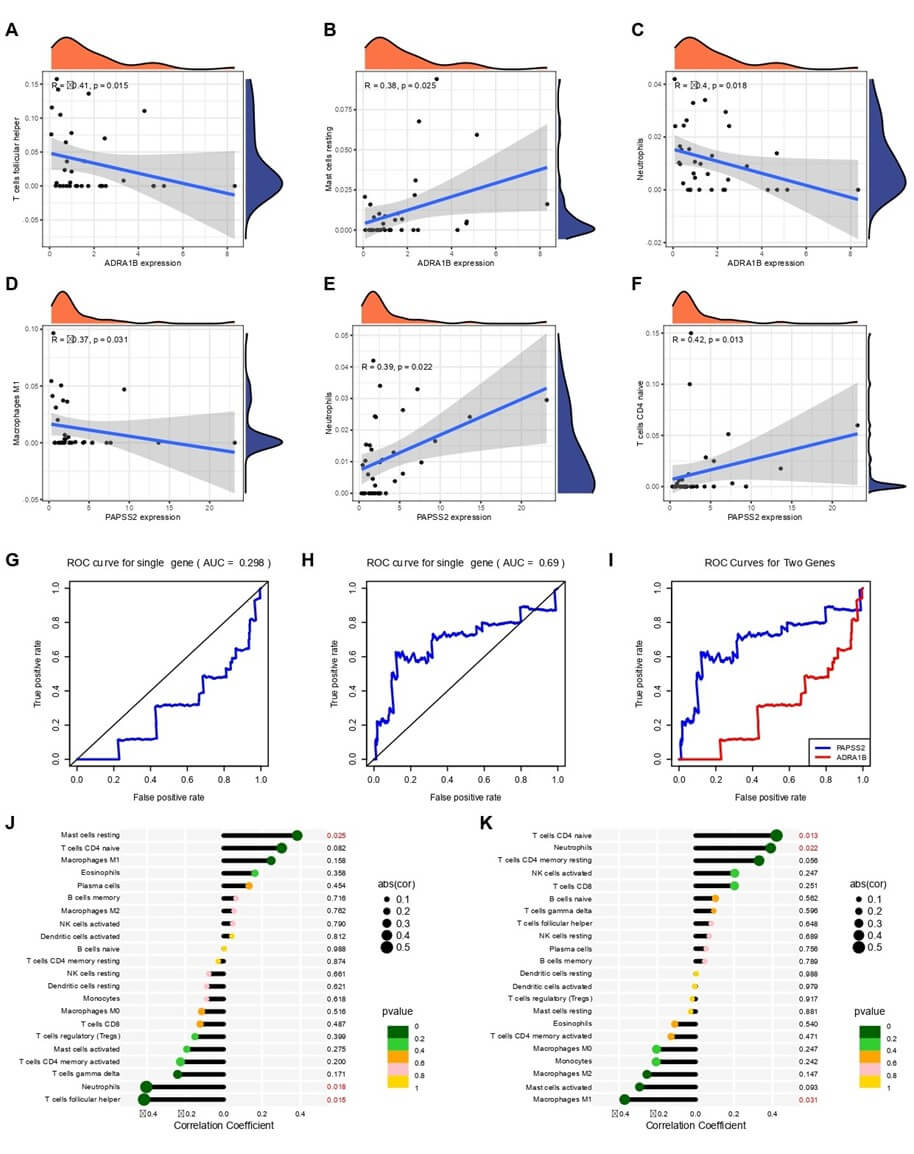
A) The scatter plot and density plot of the correlation between the expression of the core gene ADRA1B in thyroid cancer brain metastasis and T cell follicular helper cells show the correlation between the expression of the core gene ADRA1B in thyroid cancer brain metastasis and T cell follicular helper cells. The correlation coefficient R is -0.41, and the p-value is 0.015, indicating a significant negative correlation between the two. B) The scatter plot and density plot of the correlation between the expression of the core gene ADRA1B in thyroid cancer brain metastasis and resting mast cells show the correlation between the expression of the core gene ADRA1B in thyroid cancer brain metastasis and resting mast cells. The correlation coefficient R is 0.38, and the p-value is 0.025, indicating a significant positive correlation between the two. C) The scatter plot and density plot of the correlation between the expression of the core gene ADRA1B in thyroid cancer brain metastasis and neutrophils show the correlation between the expression of the core gene ADRA1B in thyroid cancer brain metastasis and neutrophils. The correlation coefficient R is -0.4, and the p-value is 0.018, indicating a significant negative correlation between the two. D) The scatter plot and density plot of the correlation between the expression of the core gene PAPSS2 in thyroid cancer brain metastasis and M1 macrophages show the correlation between the expression of the core gene PAPSS2 in thyroid cancer brain metastasis and M1 macrophages. The correlation coefficient R is -0.37, and the p-value is 0.031, indicating a significant negative correlation between the two. E) The scatter plot and density plot of the correlation between the expression of the core gene PAPSS2 in thyroid cancer brain metastasis and eosinophils show the correlation between the expression of the core gene PAPSS2 in thyroid cancer brain metastasis and eosinophils. The correlation coefficient R is 0.39, and the p-value is 0.022, indicating a significant positive correlation between the two. F) The scatter plot and density plot of the correlation between the expression of the core gene PAPSS2 in thyroid cancer brain metastasis and resting CD4 T cells show the correlation between the expression of the core gene PAPSS2 in thyroid cancer brain metastasis and resting CD4 T cells. The correlation coefficient R is 0.42, and the p-value is 0.013, indicating a significant positive correlation between the two. G) The ROC curve of the core gene ADRA1B in thyroid cancer brain metastasis (AUC = 0.298) shows the ROC curve of the single gene ADRA1B, with an AUC value of 0.298, indicating that the predictive ability of this gene is close to random guessing and the classification effect is poor. H) The ROC curve of the core gene PAPSS2 in thyroid cancer brain metastasis (AUC = 0.69) shows the ROC curve of the single gene PAPSS2, with an AUC value of 0.69, indicating that this gene has a moderate predictive ability and the classification effect is acceptable. I) The ROC curves of the two core genes (PAPSS2 and ADRA1B) in thyroid cancer brain metastasis compare the ROC curves of the two core genes (PAPSS2 and ADRA1B) in thyroid cancer brain metastasis. The blue curve represents PAPSS2, and the red curve represents ADRA1B. By comparing the two curves, the classification performance of the combination of the two genes can be assessed. J) The scatter plot of the correlation between immune cells and the expression of the core gene ADRA1B in thyroid cancer brain metastasis (correlation coefficient and p-value) shows the correlation between different immune cells and the expression of the core gene ADRA1B in thyroid cancer brain metastasis. The x-axis represents the correlation coefficient, and the y-axis lists different cell types. The color of the points represents the p-value, with darker colors indicating smaller p-values and more significant correlations. K) The scatter plot of the correlation between immune cells and the expression of the core gene PAPSS2 in thyroid cancer brain metastasis (correlation coefficient and p-value) shows the correlation between different immune cells and the expression of the core gene PAPSS2 in thyroid cancer brain metastasis. The x-axis represents the correlation coefficient, and the y-axis lists different cell types. The color of the points represents the p-value, with darker colors indicating smaller p-values and more significant correlations.
3.4. Protein Structure and Small-Molecule Docking Results
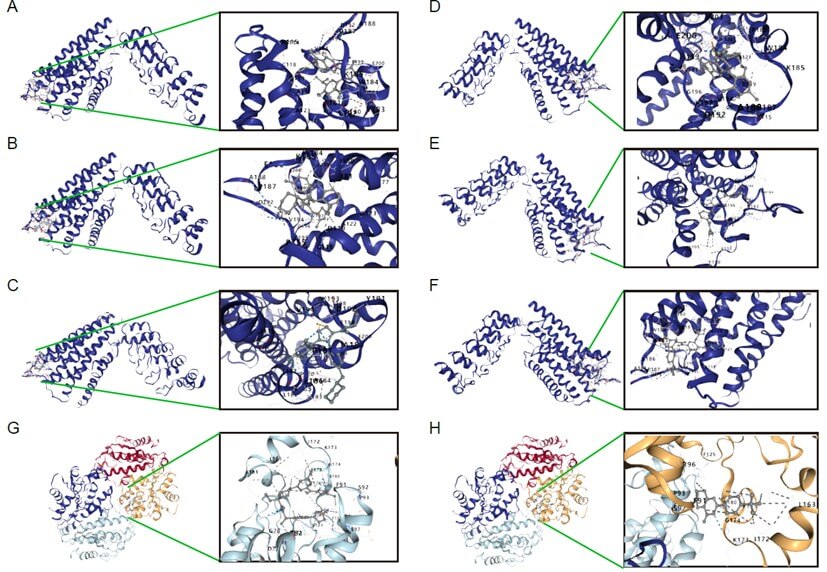
In this study, we utilized molecular docking techniques to simulate the interaction between the proteins encoded by the core genes ADRA1B and PAPSS2 and several potential therapeutic drugs. The docking analysis aimed to identify key amino acid residues and binding sites, providing a structural basis for drug design and optimization. From the docking results of the ADRA1B protein with small molecules (Figure 7), the docking analysis of the ADRA1B protein with the Ganetespib small molecule revealed interactions with several key amino acid residues. These residues include Y112, Y119, Y194, and K193, which form a stable complex with the Ganetespib small molecule through hydrogen bonds, hydrophobic interactions, ionic interactions, and π-stacking interactions. These interactions are important for the binding affinity and stability of the drug. The docking analysis of the ADRA1B protein with the IDH-C35 small molecule identified interactions with residues such as Y119, Y194, D192, L181, B187, and A188. These residues are involved in the folding and stability of the protein and play an important role in the binding characteristics of the drug (Table 4).
On the other hand, the docking results of the PAPSS2 protein with small molecules showed that the docking analysis of the PAPSS2 protein with the BLU-667 small molecule revealed that lysine residues such as K161, K165, K172, K176, and K177 participate in the stabilization of the protein through the formation of salt bridges or hydrogen bonds (Figure 7). The R82 arginine residue contributes to the solubility and binding characteristics of the protein through hydrogen bond formation or charge interactions mediated by its guanidinium group. The docking analysis of the PAPSS2 protein with the XAV-939 small molecule revealed that lysine residues such as K172, K175, and K173 play important roles in the stabilization and function of the protein. The F91 phenylalanine residue participates in hydrophobic interactions through its phenyl ring, which affects the folding and stability of the protein (Table 3).
Table. 3. Molecular docking results of the PAPSS2 gene.
|
Small molecule |
Binding Energy |
Pocket Position |
Interaction Residues |
Interaction Type |
|
XAV-939 |
-8.4 |
C1 |
Chain A: ASN88 LEU89 ARG102 Chain B: SER51 LYS55 GLY78 ARG82 ASN88 LEU89 PHE91
SER92 PR093 GLY94 ASP95 ARG96 GLU97 GLU98 ASN99 ILE100 ARG102 SER120 PHE121
ILE122 SER123 PR0124 PHE125 ASP128 LYS161 LEU163 ILE172 LYS173 GLY174 PHE175
THR176 SER180 Chain C: GLY94 GLU97 Chain D: PR093 GLY94 GLU97 |
Hydrogen bonds, hydrophobic interactions, ionic
interactions, π-π stacking interactions |
|
BLU-667 |
-11.8 |
C3 |
Chain C: SER51 LYS55 THR56 PHE60 ASP77 GLY78 ASP79
VAL81 ARG82 HIS83 ASN86 ARG87 LEU89 PHE91 SER92 PR093 ARG96 GLU97 ASN99
ILE100 SER120 PHE121 ILE122 SER123 PR0124 PHE125 ASP128 LYS161 LEU163 ILE172
LYS173 GLY174 PHE175 THR176 SER180 ASP181 Chain D: HIS24 |
Hydrogen bonds, hydrophobic interactions, ionic
interactions, π-π stacking interactions |
Table. 4. Molecular docking results of the ADRA1B
gene.
|
Small molecule |
Binding Energy |
Pocket Position |
Interaction Residues |
Interaction Type |
|
Ganetespib |
-9.8 |
C1 |
VAL98 SER102 LEU105 TYR110 VAL112 GLY114 ARG115
PHE117 CYS118 ASP119 TRP121 ALA122 ALA123 ASP125 VAL126 SER177 PRO180 LEU181
LEU182 TRP184 LYS185 GLU186 PRO187 ALA188 TYR191 ASP192 LYS193 VAL194 CYS195
GLY196 VAL197 THR198 GLU199 GLU200 TYR203 PHE310 ASP327 PHE330 LYS331 VAL332
LEU334 TRP335 TYR338 |
Hydrogen bond, hydrophobic interaction, ionic
interaction, π-π stacking interaction |
|
IDH-C35 |
-10 |
C1 |
SER102 LEU105 TYR110 VAL112 GLY114 ARG115 PHE117
CYS118 ASP119 TRP121 ALA122 ALA123 ASP125 VAL126 SER177 PRO180 LEU181 LEU182
TRP184 LYS185 GLU186 PRO187 ALA188 PRO189 TYR191 ASP192 LYS193 VAL194 CYS195
GLY196 VAL197 THR198 GLU199 GLU200 TYR203 ASP327 ALA328 PHE330 LYS331 LEU334
TRP335 TYR338 |
Hydrogen bond, hydrophobic interaction, ionic
interaction, π-π stacking interaction |
|
XL-888 |
-9.8 |
C1 |
LEU105 TYR110 VAL112 GLY114 ARG115 PHE117 CYS118
ASP119 TRP121 ALA122 ALA123 ASP125 VAL126 CYS129 PRO180 LEU181 TRP184 LYS185
GLU186 PRO187 ALA188 PRO189 TYR191 ASP192 LYS193 VAL194 CYS195 GLY196 VAL197
THR198 GLU199 GLU200 TYR203 SER207 TRP307 PHE310 PHE311 LEU314 ASP327 ALA328
PHE330 LYS331 LEU334 TYR338 |
Hydrogen bond, hydrophobic interaction, ionic
interaction, π-π stacking interaction |
|
Luminespib |
-8.6 |
C3 |
SER47 VAL48 VAL51 LEU52 PHE55 ILE56 ILE60 CYS95
LEU99 PRO100 SER102 ALA103 GLU106 VAL107 ALA328 LYS331 VAL332 LEU334 TRP335
LEU336 GLY337 TYR338 PHE339 |
Hydrogen bond, hydrophobic interaction, ionic
interaction, π-π stacking interaction |
|
spebrutinib |
-8.6 |
C1 |
SER102 LEU105 TYR110 VAL112 GLY114 ARG115 PHE117
CYS118 ASP119 TRP121 ALA122 ALA123 ASP125 VAL126 CYS129 SER177 ILE178 PRO180
LEU181 TRP184 LYS185 GLU186 PRO187 ALA188 TYR191 ASP192 LYS193 VAL194 CYS195
GLY196 VAL197 THR198 GLU199 GLU200 TYR203 TRP307 PHE310 PHE311 LEU314 ASP327
PHE330 LYS331 LEU334 TRP335 TYR338 |
Hydrogen bond, hydrophobic interaction, ionic
interaction, πーπ stacking interaction |
|
PF-4942847 |
-9.8 |
C1 |
LEU105 GLY114 ARG115 CYS118 ASP119 TRP121 ALA122
ALA123 ASP125 VAL126 SER177 ILE178 PRO180 LEU181 LEU182 TRP184 LYS185 GLU186
PRO187 ALA188 PRO189 TYR191 ASP192 LYS193 VAL 194 CYS195 GLY196 VAL197 THR198
GLU199 GLU200 TYR203 PHE310 PHE311 ASP327 ALA328 PHE330 LYS331 LEU334 TYR338 |
Hydrogen bond, hydrophobic interaction, ionic
interaction, π-π stacking interaction |
These docking analysis results not only provide new insights into the mechanisms of action of the ADRA1B and PAPSS2 genes in thyroid cancer brain metastasis but also offer potential targets for the development of new therapeutic strategies. By identifying key amino acid residues involved in drug interactions, we can more precisely design drugs targeting these genes, thereby improving treatment efficacy and reducing side effects.
3.5. Survival Analysis Results
In this study, to further explore the relationship between the expression levels of the ADRA1B and PAPSS2 genes and the survival rate of patients with thyroid cancer brain metastasis, the potential of these genes as prognostic biomarkers was assessed through survival analysis.
The survival curve (Figure 6) illustrates the association between ADRA1B gene expression levels and overall patient survival. The curve analysis reveals that high expression levels of the ADRA1B gene are correlated with longer survival times, suggesting that this gene may have tumor-suppressive effects (Figure 5). The statistical analysis of the survival curve indicates that patients with higher ADRA1B gene expression levels have significantly better survival outcomes compared to those with lower expression levels (p = 0.01) (Figure 2).
The survival curve (Figure 6) depicts the relationship between PAPSS2 gene expression levels and patient survival rates. The results show that high expression levels of the PAPSS2 gene are associated with shorter survival times, indicating that this gene may have oncogenic effects. The statistical analysis of the survival curve further confirms this observation, with patients having higher PAPSS2 gene expression levels exhibiting significantly poorer survival outcomes compared to those with lower expression levels (p = 0.022).
The correlation coefficient analysis also indicates that ADRA1B gene expression is negatively correlated with patient survival rates (correlation coefficient = -0.41, p = 0.015). This result further supports the findings from the survival curve analysis, that is, high expression of the ADRA1B gene is associated with better survival outcomes. In contrast, PAPSS2 gene expression is positively correlated with patient survival rates (correlation coefficient = 0.39, p = 0.022), consistent with the survival curve analysis results, indicating that high expression of the PAPSS2 gene is associated with poorer survival outcomes (Figure 4).

A) Linear time series plot of the expression of the core gene ADPA1B in thyroid cancer brain metastasis. This figure presents the expression trend of the core gene ADRA1B over the entire time series in a continuous line format. It can be observed that the expression level of the ADRA1B gene fluctuates significantly in the early stage (time period 0 to 1), with a high peak, and then gradually decreases and tends to stabilize in the later stage. This trend may reflect the high activity of this gene at early time points, followed by a gradual decrease and entry into a stable expression state. B) Linear time series plot of the expression of the core gene PAPSS2 in thyroid cancer brain metastasis. The expression changes of the core gene PAPSS2 over the same time period are shown in a green line chart. It can be seen from the figure that the expression level of the PAPSS2 gene rapidly reaches a peak in the initial stage (time period 0 to 1), then quickly decreases, and remains relatively low and stable in the subsequent time periods (2 to 4). This trend indicates that the PAPSS2 gene may have a brief period of high expression activity in the early stage, which is then rapidly regulated. C) Scatter time series plot of the expression of the core gene ADPA1B in thyroid cancer brain metastasis. The discrete expression values of the ADRA1B gene at different time points are indicated by dots in the figure, with a trend line (red) superimposed to show the overall change trend. It can be observed that although there are significant fluctuations in the expression values, the overall trend shows that the expression level gradually decreases over time. D) Scatter time series plot of the expression of the core gene PAPSS2 in thyroid cancer brain metastasis. This figure indicates the discrete expression values of the PAPSS2 gene in the time series with dots, similar to the ADRA1B gene. Although the distribution of the data points has a certain degree of dispersion, the trend line (red) indicates that the expression level of the PAPSS2 gene shows a downward trend, with the most significant rapid decrease at the initial time points. E) Scatter plot of the expression of the two core genes (ADPA1B and PAPSS2) in thyroid cancer brain metastasis with risk classification. The scatter plot intuitively compares the expression levels of the two core genes (ADRA1B and PAPSS2) in thyroid cancer brain metastasis, with red and green representing high-risk and low-risk classifications, respectively. It can be seen from the figure that high-risk samples are more concentrated in specific high-expression areas, while low-risk samples are more dispersed, indicating that the expression of these two genes may be closely related to risk classification. F) Boxplot comparison of the expression levels of the two core genes ADPA1B and PAPSS2 and immune genes in thyroid cancer brain metastasis. This figure compares the distribution levels of the expression of the two core genes ADRA1B and PAPSS2 in immune genes through boxplots. It can be observed that there are differences in the expression values of different genes in the immune gene environment, which may reflect the gene-specific functions in the immune environment. This trend provides a basis for further exploration of the relationship between genes and immune infiltration.
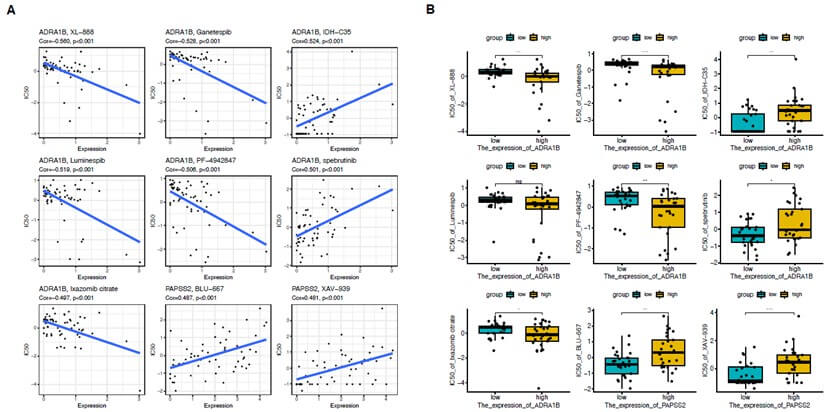
A) Scatter plots show the correlation between the expression levels of the two core genes (ADRA1B and PAPSS2) in thyroid cancer brain metastasis and the IC50 values of various drugs. Each point represents a sample, and the blue line indicates the linear regression trend. The correlation coefficient (Cor) and p-value are annotated in each subplot. For the core gene ADRA1B in thyroid cancer brain metastasis. It shows significant negative correlations with XL-888, Ganetespib, Luminespib, PF-4942847, and Ixazomib citrate, indicating that high gene expression is associated with increased sensitivity to these drugs. In contrast, it shows positive correlations with IDH-C35 and Spebrutinib. For the core gene PAPSS2 in thyroid cancer brain metastasis. It shows significant positive correlations with BLU-667 and XAV-939. B) Boxplots compare the IC50 values of the two core genes (ADRA1B and PAPSS2) in high and low expression samples for each drug. The IC50 values of samples with high expression of the core gene ADRA1B are significantly lower for XL-888, Ganetespib, PF-4942847, and Ixazomib citrate, while they are significantly higher for IDH-C35 and Spebrutinib. The IC50 values of samples with high expression of the core gene PAPSS2 are significantly higher for BLU-667 and XAV-939. Statistical significance is annotated as follows, ns (not significant), (p < 0.05), (p < 0.01), (p < 0.001).
These survival analysis results not only reveal the potential prognostic value of the ADRA1B and PAPSS2 genes in thyroid cancer brain metastasis but also provide new targets for future therapeutic strategies. By identifying genes significantly correlated with patient survival rates, we can gain a better understanding of the molecular mechanisms underlying thyroid cancer brain metastasis and provide a scientific basis for the development of new treatment methods.
3.6. Drug Sensitivity Analysis Results
In this study, we investigated the drug sensitivity of the ADRA1B and PAPSS2 genes in thyroid cancer brain metastasis by analyzing the correlation between gene expression and drug IC50 values. We employed scatter plots, correlation coefficients, and p-value statistical analysis methods.
From the scatter plots, we observed that the expression level of the ADRA1B gene is significantly negatively correlated with the IC50 values of several drugs. For example, the correlation coefficients with XL-888, Ganetespib, and PF-4942847 are -0.560, -0.528, and -0.506, respectively, with corresponding p-values all less than 0.05, indicating that these correlations are statistically significant. These results suggest that high expression of the ADRA1B gene is associated with increased sensitivity to these drugs (Figure 6).
Another scatter plot shows that the expression level of the PAPSS2 gene is significantly positively correlated with the IC50 values of BLU-667 and XAV-939, with correlation coefficients of 0.487 and 0.481, respectively, and corresponding p-values both less than 0.05. This further confirms that these genes may play a role in promoting thyroid cancer brain metastasis.
2.3. Statistical Analysis
These analysis results provide new insights into the mechanisms of action of the ADRA1B and PAPSS2 genes in thyroid cancer brain metastasis and offer potential targets for the development of new therapeutic strategies. Specifically, the expression levels of these genes may serve as biomarkers for predicting the response of patients with thyroid cancer brain metastasis to specific drugs. By identifying genes significantly correlated with drug sensitivity, we can more precisely design drugs targeting these genes, thereby improving treatment efficacy and reducing unnecessary side effects.
4. Discussion
This study comprehensively analyzed the expression patterns, immune correlations, drug sensitivity, and protein structure-small molecule interactions of the ADRA1B and PAPSS2 genes in thyroid cancer brain metastasis, revealing their potential roles in disease progression.
Adrenergic receptor alpha 1B (ADRA1B) is a member of the adrenergic receptor alpha 1 (ADRA1) subfamily and participates in the regulation of processes such as cell proliferation, differentiation, and apoptosis [20, 21]. In recent years, the role of ADRA1B in tumors has attracted increasing attention. ADRA1B is upregulated in cancers such as gastric cancer and liver cancer, and it may promote tumor growth and metastasis by activating downstream signaling pathways [22, 23]. Adrenergic receptor antagonists have also been used in the treatment of cancers such as prostate cancer and breast cancer [24].
The bifunctional enzyme 3′-phosphoadenosine 5′-phosphosulfate synthase (PAPSS) exists in two isoforms, namely PAPSS1 and PAPSS2 [25]. PAPSS1 and PAPSS2 share 78% homology in their amino acid sequences and possess identical biochemical reaction functions. Their differences mainly lie in substrate affinity, with PAPSS2 exhibiting catalytic efficiency thousands of times higher than that of PAPSS1 in vivo; therefore, PAPSS2 plays the dominant role in physiological functions [26]. The core physiological function of PAPSS2 protein in humans is to participate in the activation of sulfation, which is essential for maintaining normal physiological functions. PAPSS2 has a profound impact on the sulfation of proteoglycans in the human body, thereby playing a crucial regulatory role in bone development. Many cases of skeletal dysplasia are caused by abnormal expression of PAPSS2 [27].
PAPSS2 also plays an important role in the occurrence and development of tumors. Reports have shown that PAPSS2 expression is decreased in 14 types of cancers, with the most significant reduction observed in colon cancer. In patients with colon cancer, low expression of PAPSS2 is associated with poor prognosis, particularly in advanced stages of the disease [28, 29]. In addition, loss of PAPSS2 leads to reduced formation of sulfomucins and disruption of bile acid homeostasis, thereby impairing the intestinal mucosal barrier function and making mice more susceptible to colitis and colon cancer [30]. Studies have indicated that PAPSS2 may also be involved in cisplatin resistance in endometrial cancer, acting as a tumor suppressor gene. The expression of PAPSS2 in human type I endometrial cancer is significantly higher than that in type II endometrial cancer, and PAPSS2 expression is associated with endometrial cancer subtypes. When PAPSS2 expression was downregulated by siRNA, endometrial cancer cells exhibited enhanced resistance to cisplatin and increased proliferative activity, suggesting that PAPSS2 may exert a tumor-suppressive role in endometrial cancer [30]. In contrast, in some other cancers, high expression of PAPSS2 is critical for the sulfation modification of sulfated substrates such as the pluripotent proteoglycan Versican. These sulfated substrates play key roles in tumor cell migration, invasion, and metastasis, thereby accelerating cancer progression. Reports have shown that PAPSS2 may act as an upstream regulatory gene of the transcription factor Snail, promoting Snail protein expression in breast cancer and thus enhancing cancer cell invasion and metastasis, functioning as an oncogene [31, 32]. Wu et al. [33] found that PAPSS2 expression in gastric cancer tissues was significantly higher than in control tissues, and that PAPSS2 expression was associated with tumor invasion depth and lymph node metastasis. Transwell assay results showed that knockdown of PAPSS2 significantly inhibited the invasion and migration abilities of gastric cancer cells AGS and SGC-7901 (P < 0.05). Zhang et al. [28] reported that knockout of PAPSS2 could suppress breast cancer cell migration and significantly reduce lung metastasis in nude mice. Xu et al. [27] demonstrated that PAPSS2 plays an important role in the occurrence and development of colon cancer.
In other studies, immunohistochemical staining revealed that compared with adjacent non-cancerous tissues, ADRA1B was highly expressed in PTC tissues, suggesting that this protein may play a promoting role in the progression of PTC. Western blot and real-time RT-PCR results showed that both protein and mRNA levels of ADRA1B were significantly upregulated in PTC tissues, further confirming the phenomenon of ADRA1B overexpression in PTC. This finding echoes previous studies [20, 34] that reported a correlation between ADRA1B and tumor malignancy. Broso et al. [34] found that ADRA1B was highly expressed in patients with neuroblastoma, and that the use of its antagonists could inhibit neuroblastoma growth and promote differentiation. These results collectively suggest that upregulated ADRA1B expression may promote tumor cell proliferation and thereby contribute to tumor growth. Kaplan–Meier survival analysis further revealed that patients with high ADRA1B expression had a significantly increased risk of postoperative recurrence (metastasis) [35].
Our immune cell correlation analysis revealed that the ADRA1B gene was significantly negatively correlated with the activity of multiple immune cell types, whereas PAPSS2 showed a positive correlation. This suggests that ADRA1B may play a role in suppressing immune responses, while PAPSS2 may enhance immune cell activity. In line with the findings in (Figure 4), we observed that ADRA1B expression was significantly negatively correlated with Tfh cells, whereas PAPSS2 was significantly negatively correlated with M1 macrophage infiltration. This observation is biologically plausible. Tfh cells, as a critical subset supporting B-cell differentiation and antibody production, have been shown to be closely associated with antitumor immune responses and the formation of tertiary lymphoid structures in various cancers. High expression of ADRA1B, if suppressing Tfh cell infiltration, may weaken local adaptive immune responses in the tumor microenvironment, thereby facilitating the occurrence and progression of brain metastases. On the other hand, M1 macrophages usually secrete pro-inflammatory cytokines such as IL-12 and TNF-α, playing a crucial role in limiting tumor growth and metastasis. The negative correlation between PAPSS2 expression and M1 macrophages suggests that upregulation of PAPSS2 may be associated with an immunosuppressive microenvironment, leading to a reduction in antitumor inflammatory responses.
Based on the immune correlation analysis, we found that the expression level of the target gene was closely associated with the infiltration of multiple immune cell types. In particular, the gene showed a significant positive correlation with neutrophils (R = 0.39, p = 0.022). Previous studies have demonstrated that neutrophils exhibit high plasticity within the tumor microenvironment, with their functions classified into pro-tumor (N2 type) and anti-tumor (N1 type) subsets [36]. Notably, tumor-associated neutrophils (TANs) can promote tumor cell invasion, angiogenesis, and distant metastasis through the release of reactive oxygen species (ROS), proteases, and the formation of neutrophil extracellular traps (NETs) [37]. Our results suggest that the gene may facilitate thyroid cancer brain metastasis by enhancing the recruitment or activation of TANs. Clinically, potential therapeutic strategies targeting neutrophils or NETs (such as CXCR2 inhibitors and PAD4 inhibitors) have already been proposed. Therefore, this finding not only has biological plausibility but also holds translational medical value.
On the other hand, we also observed a positive correlation between gene expression and resting mast cells (R = 0.38, p = 0.025). As an important component of innate immunity, mast cells play a dual role in tumor progression. On one hand, they can promote angiogenesis, matrix degradation, and immunosuppression by releasing factors such as VEGF and TNF-α, thereby supporting tumor growth and metastasis [38]. On the other hand, under specific microenvironmental conditions, mast cells may secrete chemokines that facilitate the infiltration of effector T cells, thus exerting antitumor effects [39]. Therefore, our findings suggest that the gene may influence the recruitment and functional state of mast cells within the tumor immune microenvironment, thereby participating in the regulation of immune balance.
In addition, gene expression was positively correlated with naïve CD4 T-cell infiltration (R = 0.42, p = 0.013). CD4 T cells occupy a central role in antitumor immune responses, and their differentiation into effector subsets (such as Th1, Th17, and Tfh) is crucial for sustaining effective antitumor immunity [40]. An increase in naïve CD4 T-cell infiltration, without further differentiation into effector T cells, may indicate the presence of immunosuppressive signals or insufficient antigen stimulation within the tumor microenvironment, thereby weakening the antitumor response. Taken together with previous studies, this result suggests that the target gene may regulate the effectiveness of antitumor immune responses by influencing CD4 T-cell activation and differentiation pathways.
In summary, our results reveal the potential mechanisms of the target gene in the infiltration of immune cells such as neutrophils, mast cells, and naïve CD4 T cells. These findings are consistent with previous studies- ADRA1B has been regarded as an immunosuppressive gene, whereas PAPSS2 has been associated with immune activation.
Through drug sensitivity analysis, we found that the expression of the ADRA1B and PAPSS2 genes is significantly correlated with the IC50 values of specific drugs, indicating that these genes may serve as potential biomarkers for predicting drug responses. Specifically, high expression of the ADRA1B gene is associated with increased sensitivity to certain drugs, while high expression of the PAPSS2 gene is linked to increased resistance to other drugs. These findings provide a scientific basis for developing personalized treatment plans and selecting the most effective therapeutic drugs.
The molecular docking analysis further revealed the interactions between the proteins encoded by ADRA1B and PAPSS2 and potential therapeutic drugs. These analysis results not only provide a structural basis for understanding how these genes respond to specific drugs but also offer new directions for drug design and optimization. In particular, the identified key amino acid residues may become targets for drug action.
Although this study provides important insights, several limitations remain. First, our analysis was primarily based on in vitro experiments and computational simulations, and these conclusions still require validation through in vivo studies. Second, the study mainly focused on the ADRA1B and PAPSS2 genes, whereas thyroid cancer brain metastasis may involve other related genes. In addition, the GEO dataset contained only two thyroid cancer metastasis samples, which limits the generalizability of the results. Future research should expand the sample size and include more genes to further validate and extend our findings.
In summary, this study provides important information for understanding the mechanisms of thyroid cancer brain metastasis and developing new treatment methods by analyzing the potential roles of the ADRA1B and PAPSS2 genes from multiple perspectives. These findings may help improve the prognosis and treatment outcomes for patients with thyroid cancer brain metastasis.
The purpose of disease treatment is to benefit patients and achieve comprehensive recovery of their physical, psychological, and social functions. The purpose of the development of the discipline is to analyze diseases and minimize the harm they cause to individuals, families, and society [41]. We will strive to achieve comprehensive recovery for patients, including the restoration of physical, psychological, and social functions. Through integrated treatment plans, we aim to improve the quality of life for patients and help them reintegrate into society.
REFERENCES
[1] Jin-Seok Lee, Jun Sung Lee, Hyeok Jun
Yun, et al. “Prognosis of anaplastic thyroid cancer with distant metastasis.” Cancers
(Basel), vol. 14, no. 23, pp. 5784, 2022. View at: Publisher Site | PubMed
[2] Ilana Slutzky-Shraga, Alex Gorshtein,
Aharon Popovitzer, et al. “Clinical characteristics and disease outcome of
patients with non-medullary thyroid cancer and brain metastases.” Oncol Lett,
vol. 15, no. 1, pp. 672-676, 2018. View at: Publisher Site | PubMed
[3] Hong-Jun Song, Yan-Li Xue, Yan-Hong
Xu, et al. “Rare metastases of differentiated thyroid carcinoma: pictorial
review.” Endocr Relat Cancer, vol. 18, no. 5, pp. R165-R174, 2011. View
at: Publisher Site | PubMed
[4] Jin K, Xia L, Zhang S, et al.
“Clinical characteristics and prognostic analysis of thyroid cancer brain
metastasis.” Chinese Modern Doctor, no. 14, pp. 77-81, 2022.
[5] Bingfeng Han, Rongshou Zheng, Hongmei
Zeng, et al. “Cancer incidence and mortality in China, 2022.” J Natl Cancer
Cent, vol. 4, no. 1, pp. 47-53, 2024. View at: Publisher Site | PubMed
[6] Bingfeng Han, Rongshou Zheng, Hongmei
Zeng, et al. “Global cancer statistics 2022: GLOBOCAN estimates of incidence
and mortality worldwide for 36 cancers in 185 countries.” CA Cancer J Clin,
vol. 74, no. 3, pp. 229-263, 2024. View at: Publisher Site | PubMed
[7] Zhu H, Shen L, Lv T, et al. “The
intervention effect of multimodal somatosensory exercise on patients after
total thyroidectomy for thyroid cancer.” Chinese Journal of Nursing,
vol. 58, no. 14, pp. 1691-1699, 2023.
[8] Cheng X “Brain Metastasis of
Cancer≠Terminal Illness.” Family Medicine - Choosing Medicine and Seeking
Medical Care, vol. 02, pp. 63, 2023.
[9] DI Tianyu “Evaluation of High-Risk
Factors and Prognostic Factors for Thyroid Cancer Based on the SEER Database
[Master's thesis].” Nanjing Medical University, 2022.
[10]
Bryan
R Haugen, Erik K Alexander 2, Keith C Bible, et al. “2015 American Thyroid
Association Management Guidelines for Adult Patients with Thyroid Nodules and
Differentiated Thyroid Cancer: The American Thyroid Association Guidelines Task
Force on Thyroid Nodules and Differentiated Thyroid Cancer.” Thyroid,
vol. 26, no. 1, pp. 1-133, 2016. View at: Publisher Site | PubMed
[11]
Mohamed
Abdelgadir Adam, John Pura, Lin Gu, et al. “Extent of surgery for papillary
thyroid cancer is not associated with survival: an analysis of 61,775
patients.” Ann Surg, vol. 260, no. 4, pp. 601-605, 2014. View at: Publisher Site | PubMed
[12]
Abie
H Mendelsohn, David A Elashoff, Elliot Abemayor, et al. “Surgery for papillary
thyroid carcinoma: is lobectomy enough?” Arch Otolaryngol Head Neck Surg,
vol. 136, no. 11, pp. 1055-1061, 2010. View at: Publisher Site | PubMed
[13]
Alexandria
D McDow, Susan C Pitt “Extent of Surgery for Low-Risk Differentiated Thyroid
Cancer.” Surg Clin North Am, vol. 99, no. 4, pp. 599-610, 2019. View at:
Publisher Site | PubMed
[14]
Young
Min Park, Jeong-Rok Kim, Kyung Ho Oh, et al. C”omparison of functional outcomes
after total thyroidectomy and completion thyroidectomy: Hypoparathyroidism and
postoperative complications.” Auris Nasus Larynx, vol. 46, no. 1, pp.
101-105, 2019. View at: Publisher
Site | PubMed
[15]
Ryan
K Orosco, Harrison W Lin, Neil Bhattacharyya “Ambulatory thyroidectomy: a
multistate study of revisits and complications.” Otolaryngol Head Neck Surg,
vol. 152, no. 6, pp. 1017-1023, 2015. View at: Publisher Site | PubMed
[16]
Brian
Hung-Hin Lang, Carlos K H Wong “Lobectomy is a more Cost-Effective Option than
Total Thyroidectomy for 1 to 4 cm Papillary Thyroid Carcinoma that do not
Possess Clinically Recognizable High-Risk Features.” Ann Surg Oncol,
vol. 23, no. 11, pp. 3641-3652, 2016. View at: Publisher Site | PubMed
[17]
Zaid
Al-Qurayshi, Mahmoud Farag, Mohamed A Shama, et al. “Total Thyroidectomy Versus
Lobectomy in Small Nodules Suspicious for Papillary Thyroid Cancer:
Cost-Effectiveness Analysis.” Laryngoscope, vol. 130, no. 12, pp.
2922-2926, 2020. View at: Publisher
Site | PubMed
[18]
Tian
Wen, Wang Bing “Several issues worthy of attention in the diagnosis and
treatment of distant metastatic thyroid cancer.” Chinese Journal of
Practical Surgery, vol. 44, no. 06, pp. 615-618+624, 2024.
doi:10.19538/j.cjps.issn1005-2208.2024.06.03. View at: Publisher
Site
[19]
Sun Q, Liu F “Thyroid Cancer Brain
Metastasis Treatment Status and Prospect.” Journal of Southeast University
(Medical Science Edition), vol. 44, no. 01, pp. 150-158, 2025.
[20]
Francesca
Broso, Pamela Gatto, Viktoryia Sidarovich, et al. “Alpha-1 adrenergic
antagonists sensitize neuroblastoma to therapeutic differentiation.” Cancer
Res, vol. 83, no. 16, pp. 2733-2749, 2023. View at: Publisher Site | PubMed
[21]
Ting
Wang, Yu Li, Hai-Ling Lu, et al. “β-adrenergic receptors: New target in
breast cancer.” Asian Pacific
Journal of Cancer Prevention, vol. 16, no. 18, pp. 8031-8039, 2015. View
at: Publisher Site
[22]
Tingan
Wang, Yuzhou Qin, Hao Lai, et al. “The prognostic value of ADRA1 subfamily
genes in gastric carcinoma.” Oncol Lett, vol. 18, no. 3, pp. 3150-3158,
2019. View at: Publisher Site | PubMed
[23]
Hyun
Yul Kim, Youn Joo Jung, Sang Hyup Lee, et al. “Is beta-blocker use beneficial
in breast cancer? A meta-analysis.” Oncology, vol. 92, no. 5, pp.
264-268, 2017. View at: Publisher Site | PubMed
[24]
Atsunori
Kamiya, Takeshi Hiyama, Atsushi Fujimura, et al. “Sympathetic and
parasympathetic innervation in cancer: Therapeutic implications.” Clin Auton
Res, vol. 31, no. 2, pp. 165-178, 2021. View at: Publisher Site | PubMed
[25]
Laura
M. Yerges-Armstrong, Sumbul Chai, Jeffery R. O’Connell, et al. “Gene expression
differences between offspring of long-lived individuals and controls in
candidate longevity regions: Evidence for PAPSS2 as a longevity gene.” The
Journals of Gerontology: Series A, Biological Sciences and Medical Sciences,
vol. 71, no. 10, pp. 1295-1299, 2016. View at: Publisher
Site
[26]
Stefan
Harjes, Peter Bayer, Axel J Scheidig “The crystal structure of human PAPS
synthetase 1 reveals asymmetry in substrate binding.” J Mol Biol, vol.
347, no. 3, pp. 623-635, 2005. View at: Publisher Site | PubMed
[27]
Pengfei
Xu, Yue Xi, Junjie Zhu, et al. “Intestinal sulfation is essential to protect
against colitis and colonic carcinogenesis.” Gastroenterology, vol. 161,
no. 1, pp. 271-286.e11, 2021. View at: Publisher Site | PubMed
[28]
Yihong
Zhang, Xiuqun Zou, Wenli Qian, et al. “Enhanced PAPSS2/VCAN sulfation axis is
essential for Snail-mediated breast cancer cell migration and metastasis.” Cell
Death Differ, vol. 26, no. 3, pp. 565-579, 2019. View at: Publisher Site | PubMed
[29]
Pengfei
Xu, Yue Xi, Jong-Won Kim, et al. “Sulfation of chondroitin and bile acids
converges to antagonize Wnt/β-catenin signaling and inhibit APC deficiency-induced
gut tumorigenesis.” Acta Pharm Sin B, vol. 14, no. 3, pp. 1241-1256, 2024. View
at: Publisher Site | PubMed
[30]
Mengfan
Li, Yiyun Ding, Jingge Wei, et al. “Gut microbiota metabolite indole-3-acetic
acid maintains intestinal epithelial homeostasis through mucin sulfation.” Gut
Microbes, vol. 16, no. 1, pp. 2377576, 2024. View at: Publisher Site | PubMed
[31]
K
V Venkatachalam “Human 3′-phosphoadenosine 5′-phosphosulfate (PAPS) synthase: Biochemistry, molecular biology and
genetic deficiency.” IUBMB Life, vol. 55, no. 1, pp. 1-11, 2003. View
at: Publisher Site | PubMed
[32]
Zhang
Jiayi, Wu Zhaoqiu “Research progress on the role of PAPSS2 in diseases.” Biochemical
Engineering, vol. 11, no. 1, pp. 221-223+233, 2025. View
at: Publisher Site
[33]
Wu
Y, Liu D, Xue F, et al. Effect of sulfation-modifying enzyme PAPSS2 expression
on invasion and migration of gastric cancer. Chinese Journal of General
Surgery Literature (Electronic Edition), vol. 16, no. 1, pp. 27-31, 2022.
[34]
GuiYuan
Liu, Yi Pang, YaJun Zhang, et al. “GJB4 promotes gastric cancer cell
proliferation and migration via Wnt/CTNNB1 pathway.” Onco Targets Ther,
vol. 12, pp. 6745-6755, 2019. View at: Publisher
Site | PubMed
[35]
Ji
Y, Yin L, Zhai Y, et al. “Abnormal expression of GJB4 and ADRA1B in papillary
thyroid carcinoma: Key factors affecting prognosis.” Journal of Clinical and
Pathology, vol. 45, no. 3, pp. 265-274, 2025.
[36]
Bagher
Farhood, Masoud Najafi 2, Keywan Mortezaee “CD4+ T cells in tumor immunity: A
review.” J Cell Physiol, vol. 234, no. 6, pp. 8509-8521, 2019. View
at: Publisher
Site | PubMed
[37]
Steven
Maltby, Khashayarsha Khazaie, Kelly M McNagny “Mast cells in tumor growth:
Angiogenesis, tissue remodelling and immune-modulation.” Biochim Biophys
Acta, vol. 1796, no. 1, pp. 19-26, 2009. View at: Publisher Site | PubMed
[38]
Sharon
A Oldford, Jean S Marshall “Mast cells as targets for immunotherapy of solid
tumors.” Mol Immunol, vol. 63, no. 1, pp. 113-124, 2015. View
at: Publisher Site | PubMed
[39]
Juwon
Park, Robert W Wysocki, Zohreh Amoozgar, et al. “Cancer cells induce
metastasis-supporting neutrophil extracellular DNA traps.” Sci Transl Med,
vol. 8, no. 361, pp. 361ra138, 2016. View at: Publisher Site | PubMed
[40]
Merav
E Shaul, Zvi G Fridlender “Tumor-associated neutrophils in patients with
cancer.” Nat Rev Clin Oncol, vol. 16, no. 10, pp. 601-620, 2019. View
at: Publisher Site | PubMed
[41] ao M, Hao J “The significance, barriers, and progress of active surveillance strategy for low-risk thyroid cancer.” Mod Oncol Med, vol. 33, no. 06, pp. 889-892, 2025.
[41] Gao M, Hao J “The significance, barriers, and progress of active surveillance strategy for low-risk thyroid cancer.” Mod Oncol Med, vol. 33, no. 06, pp. 889-892, 2025.